The following presentation explores sales trends, customer traffic, and top-selling drinks for a coffee shop. Through data visualization, I highlight key insights, including peak performance months and product popularity.

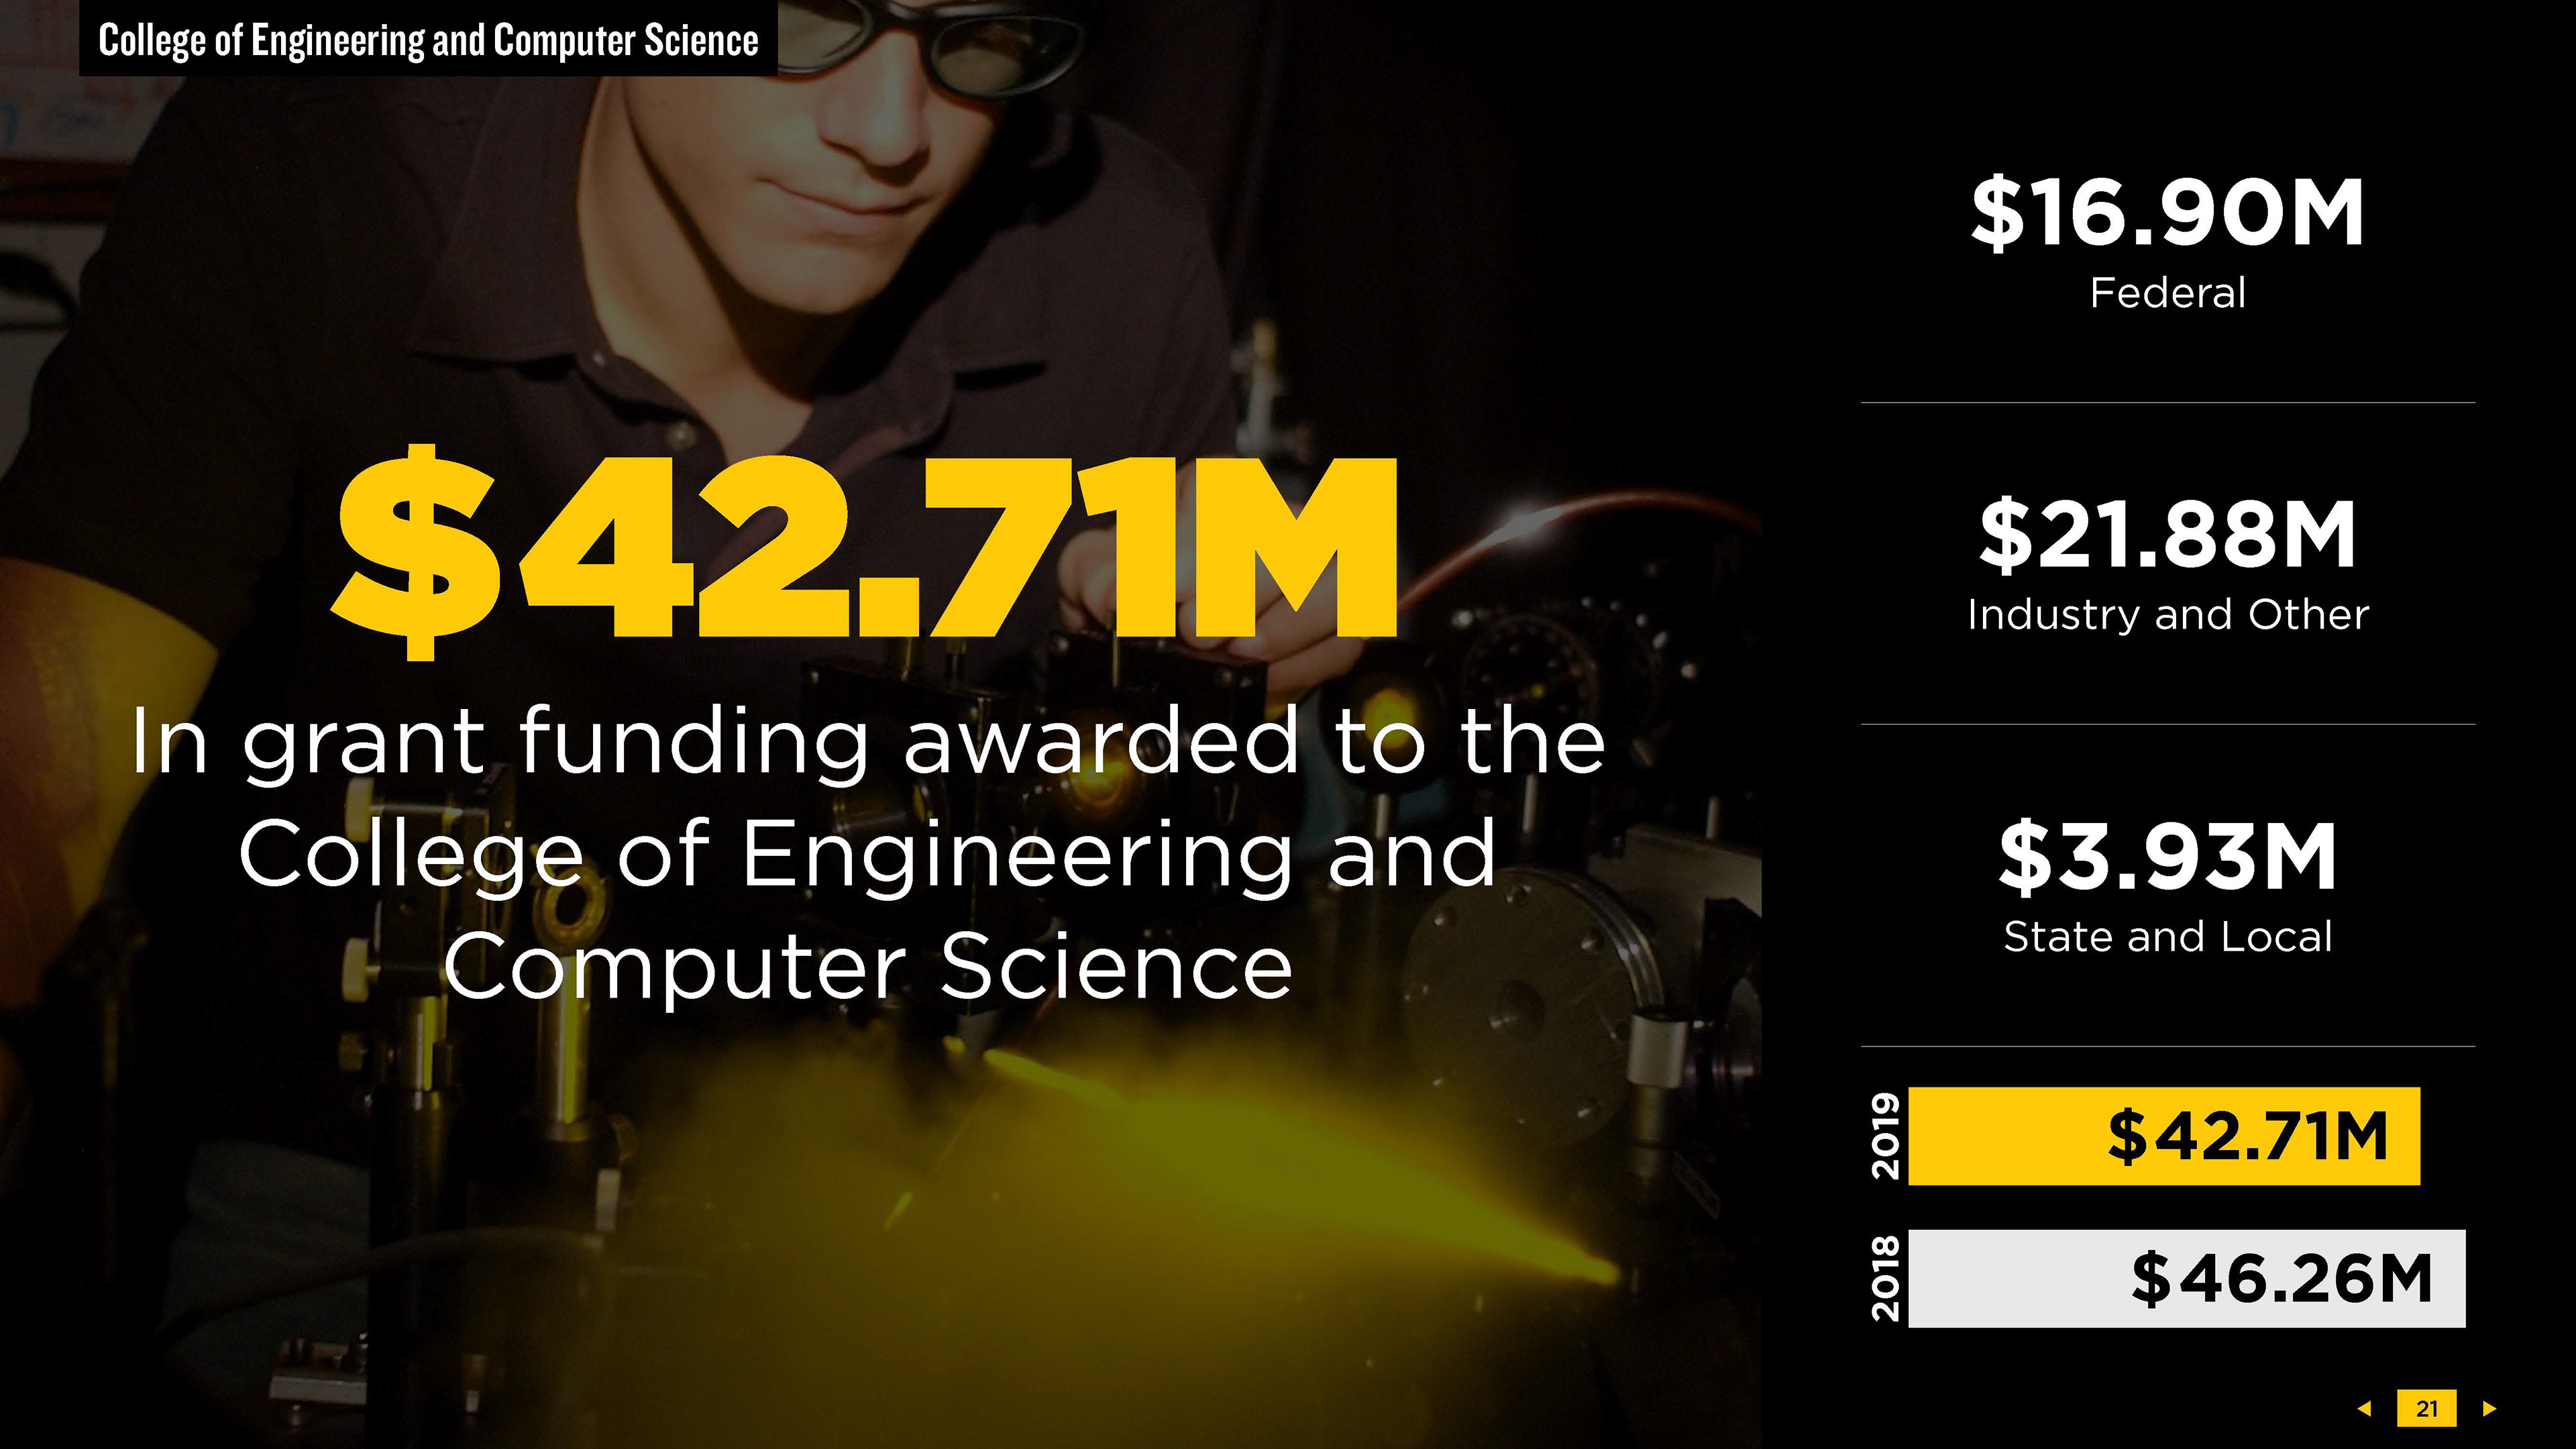
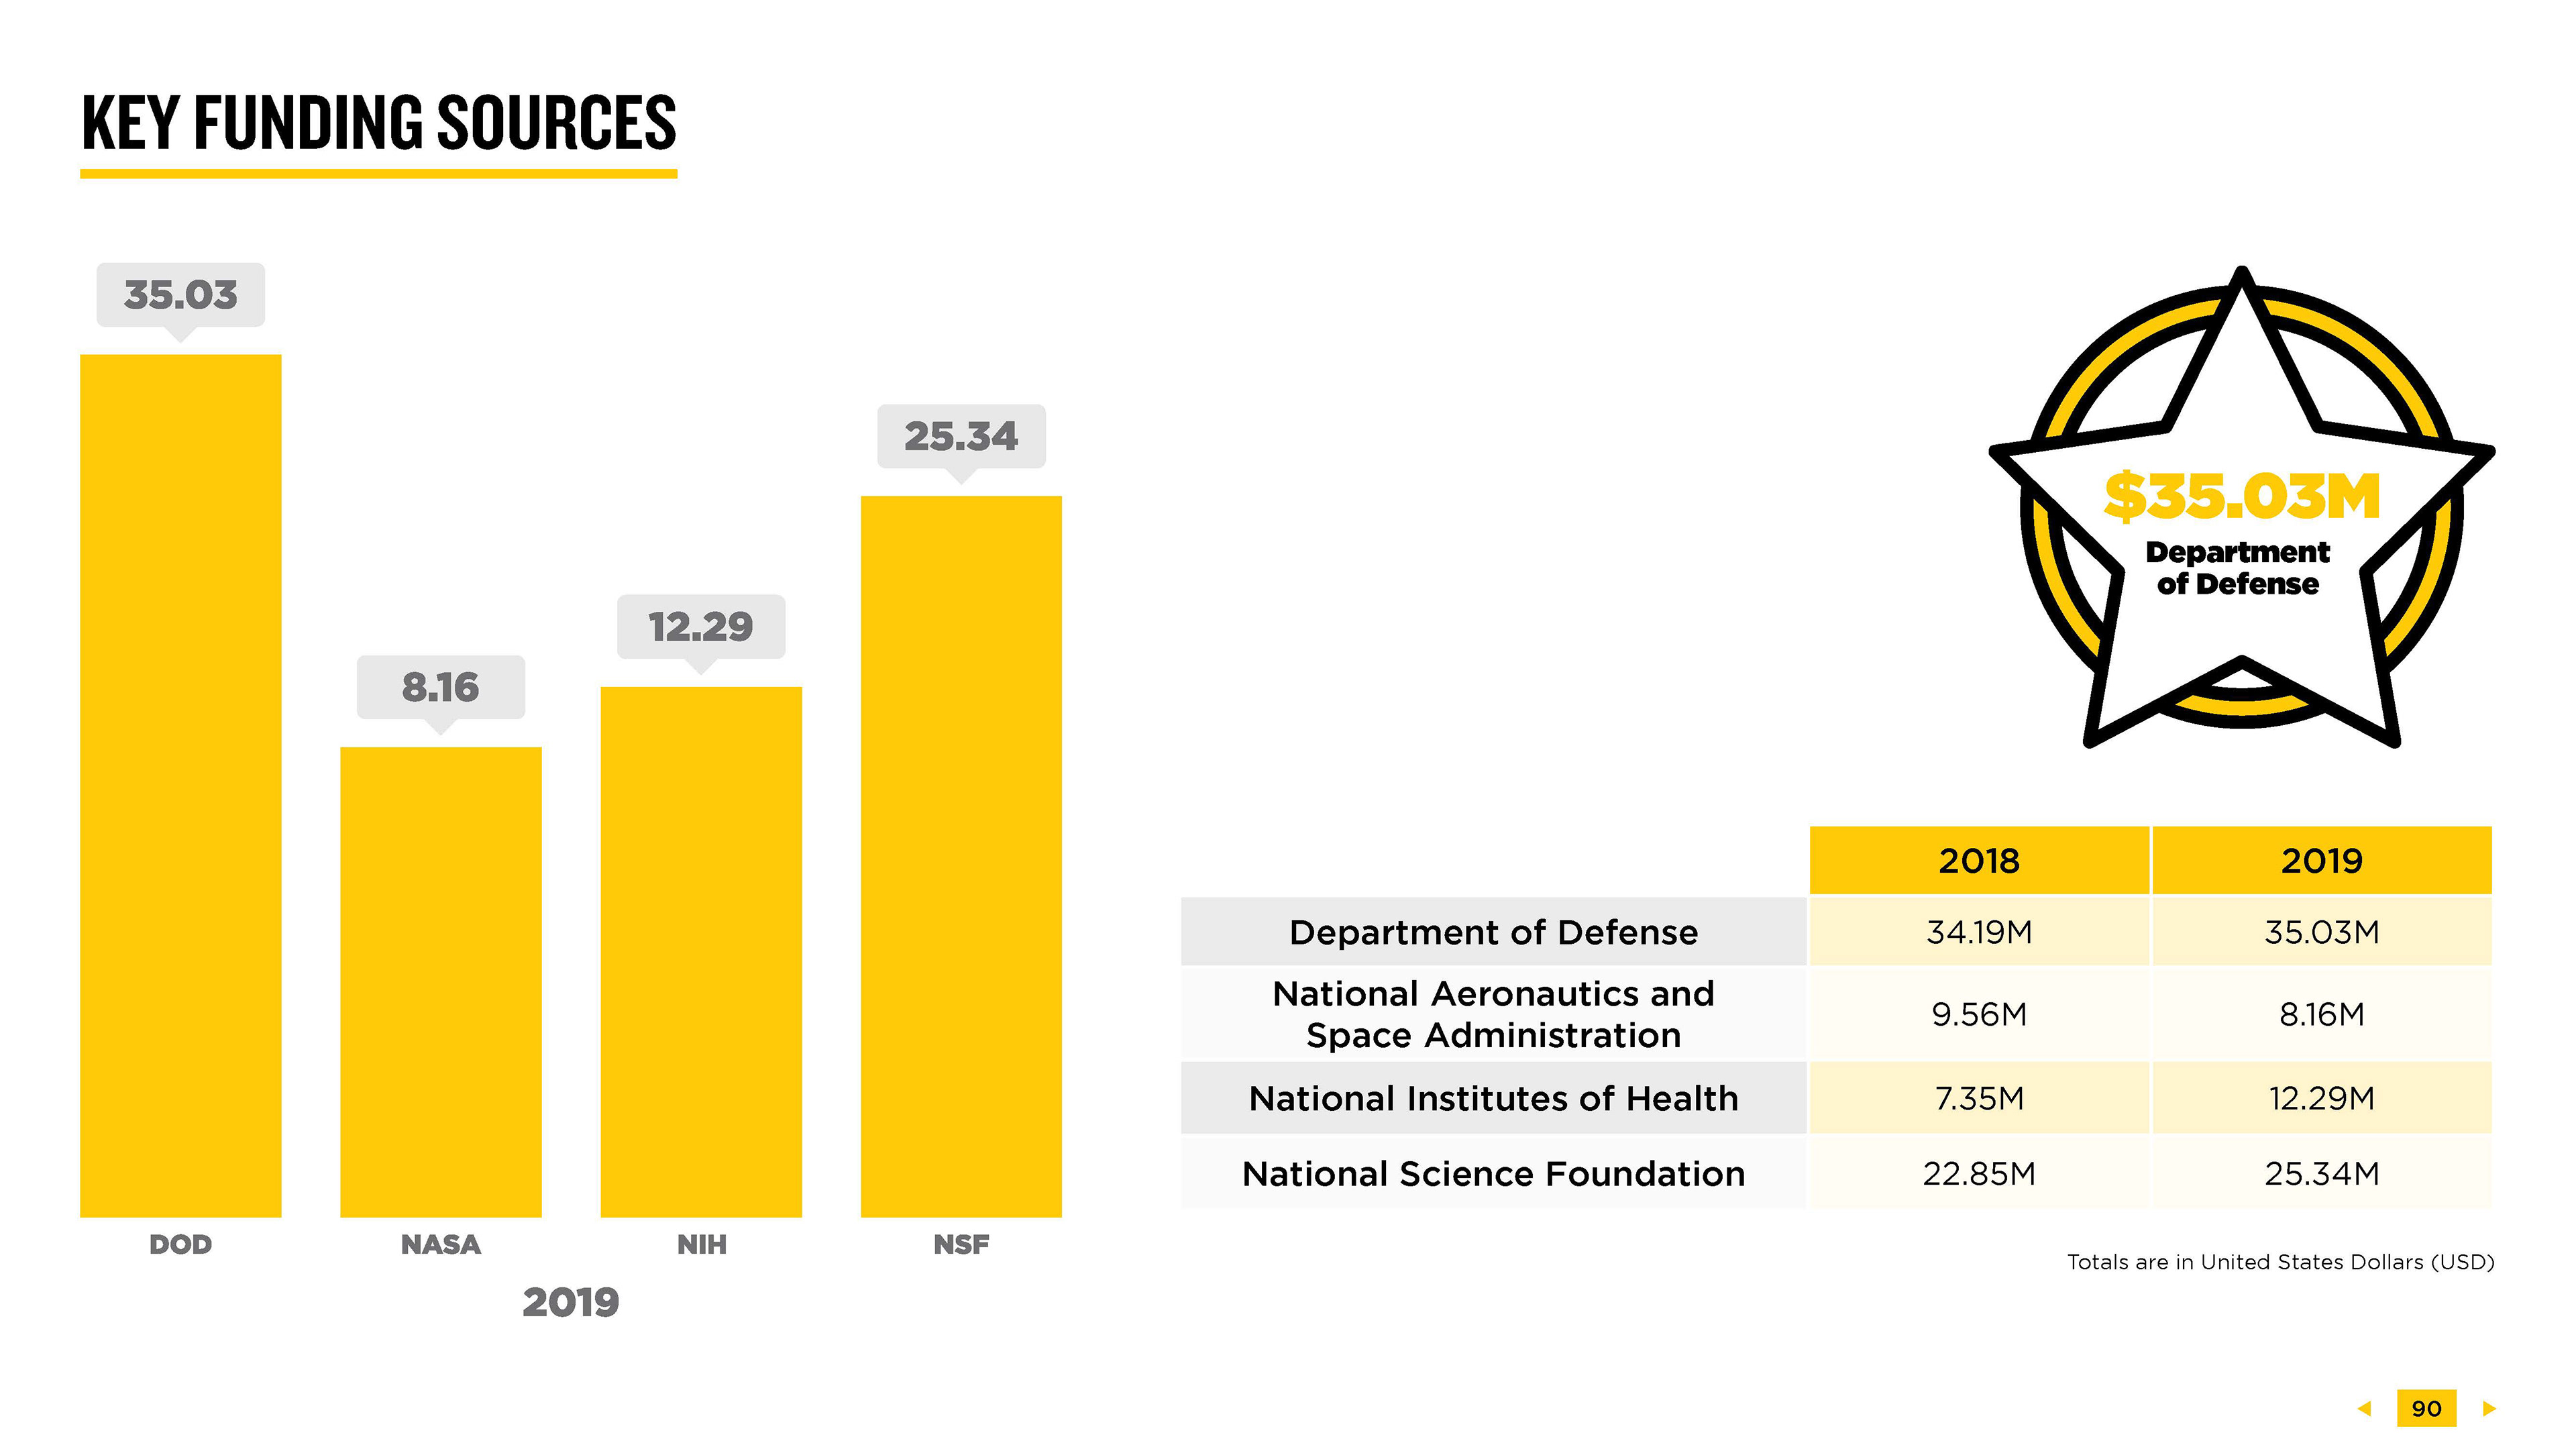
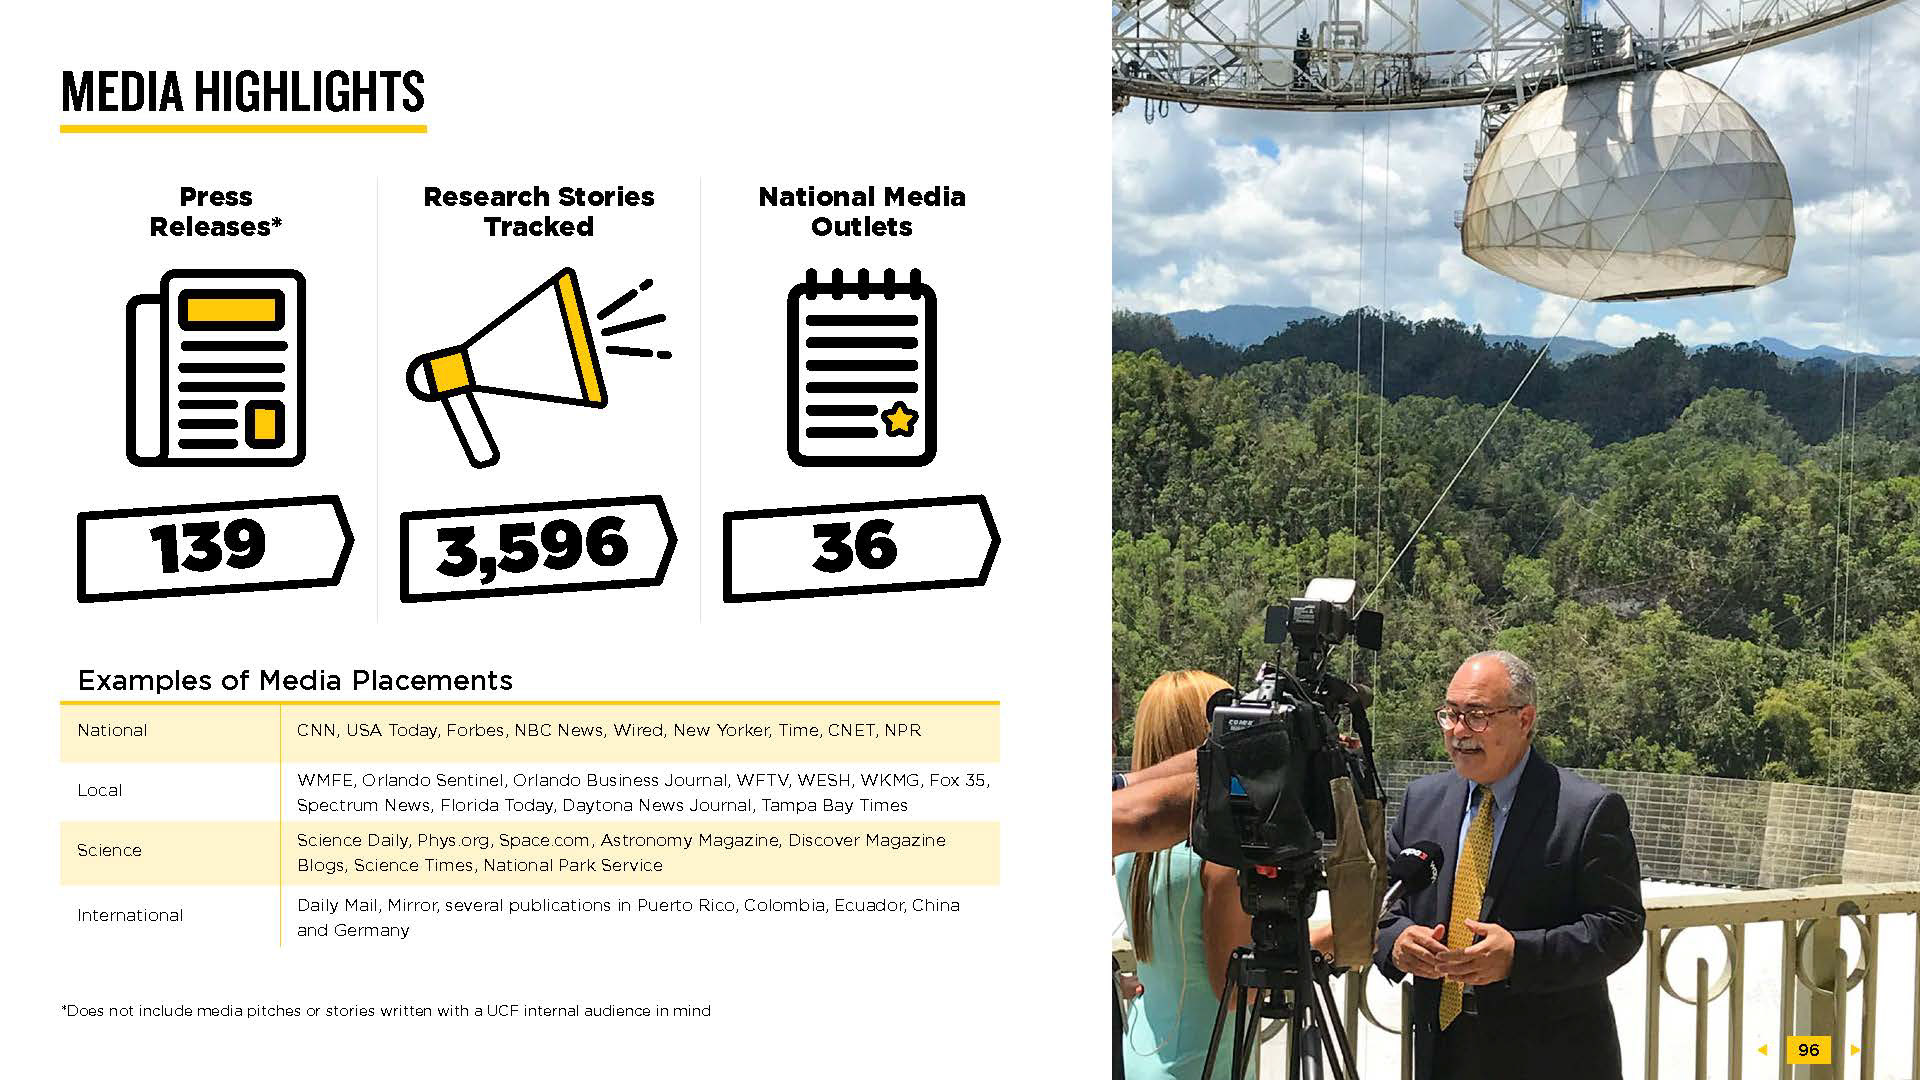
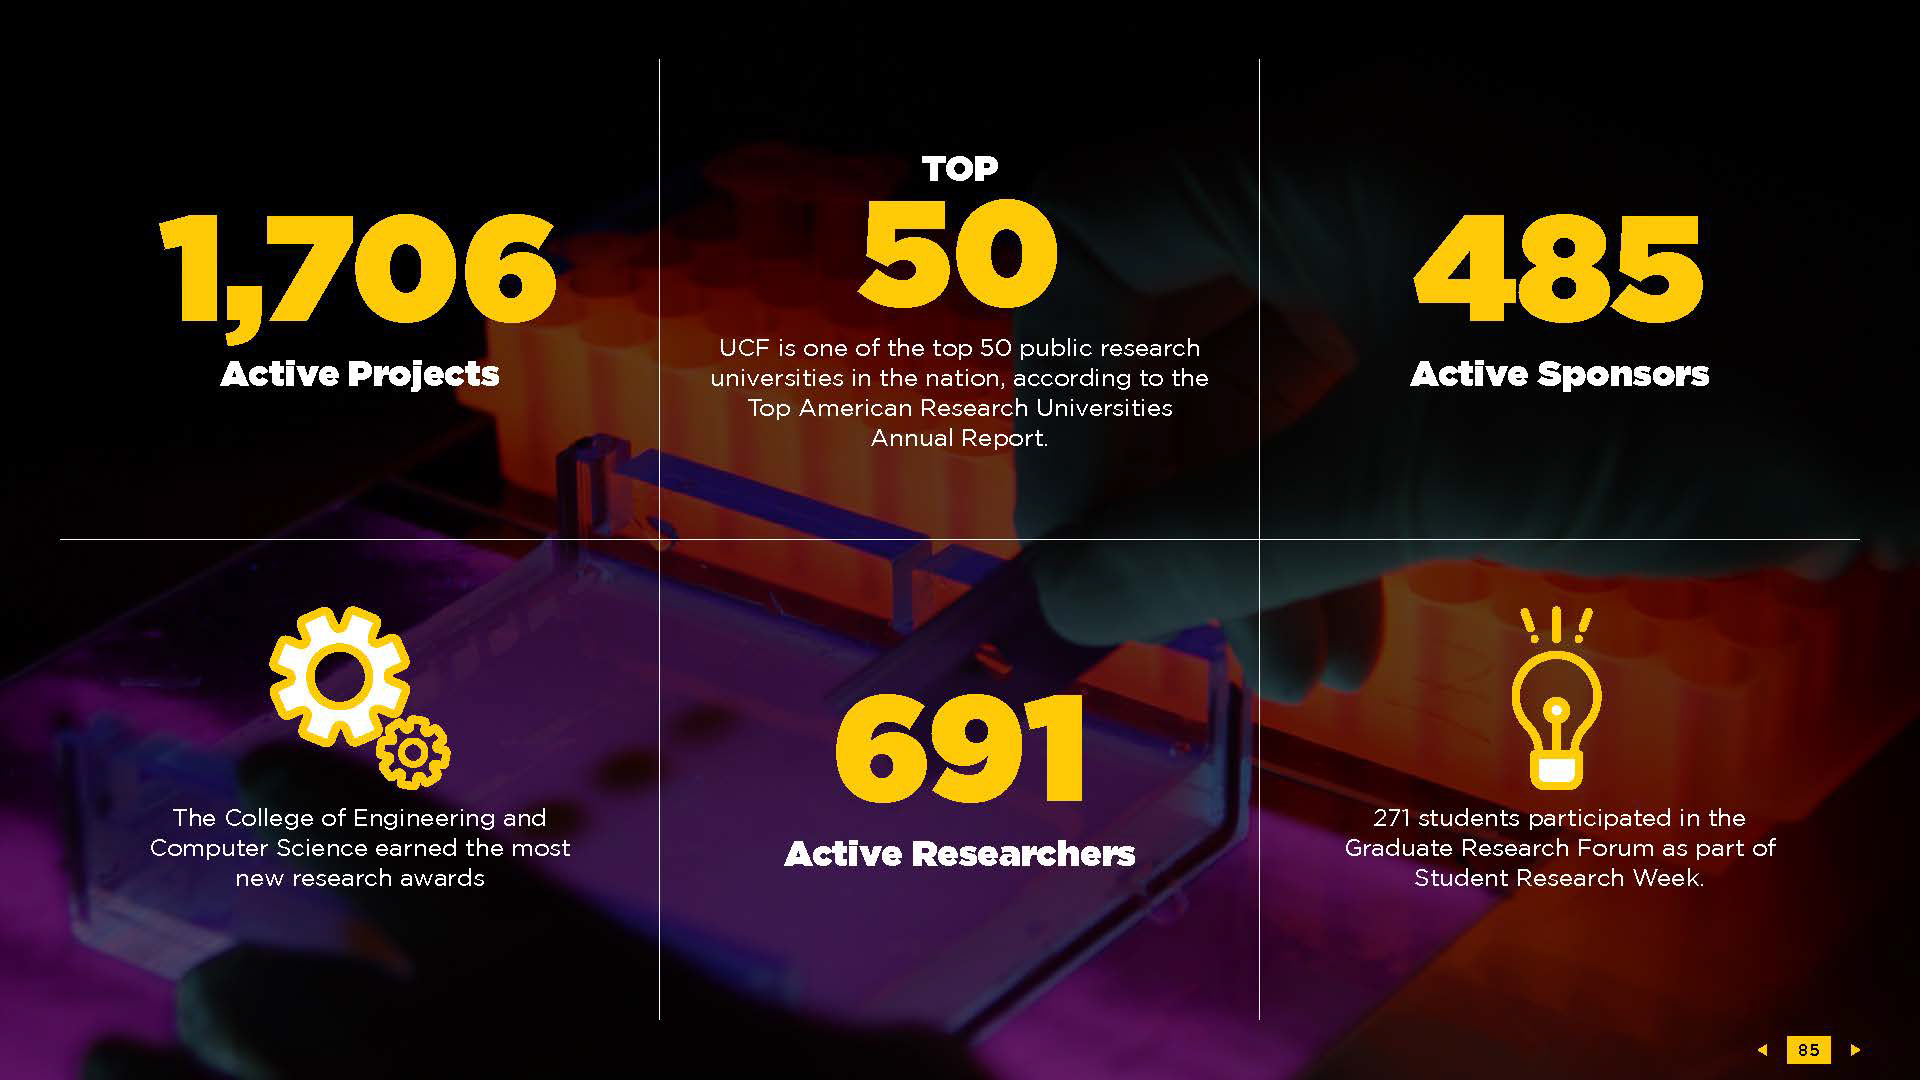
The following images are excerpts from an annual report that I designed for the University of Central Florida. It was distributed as an interactive PDF presentation with clickable links and buttons.

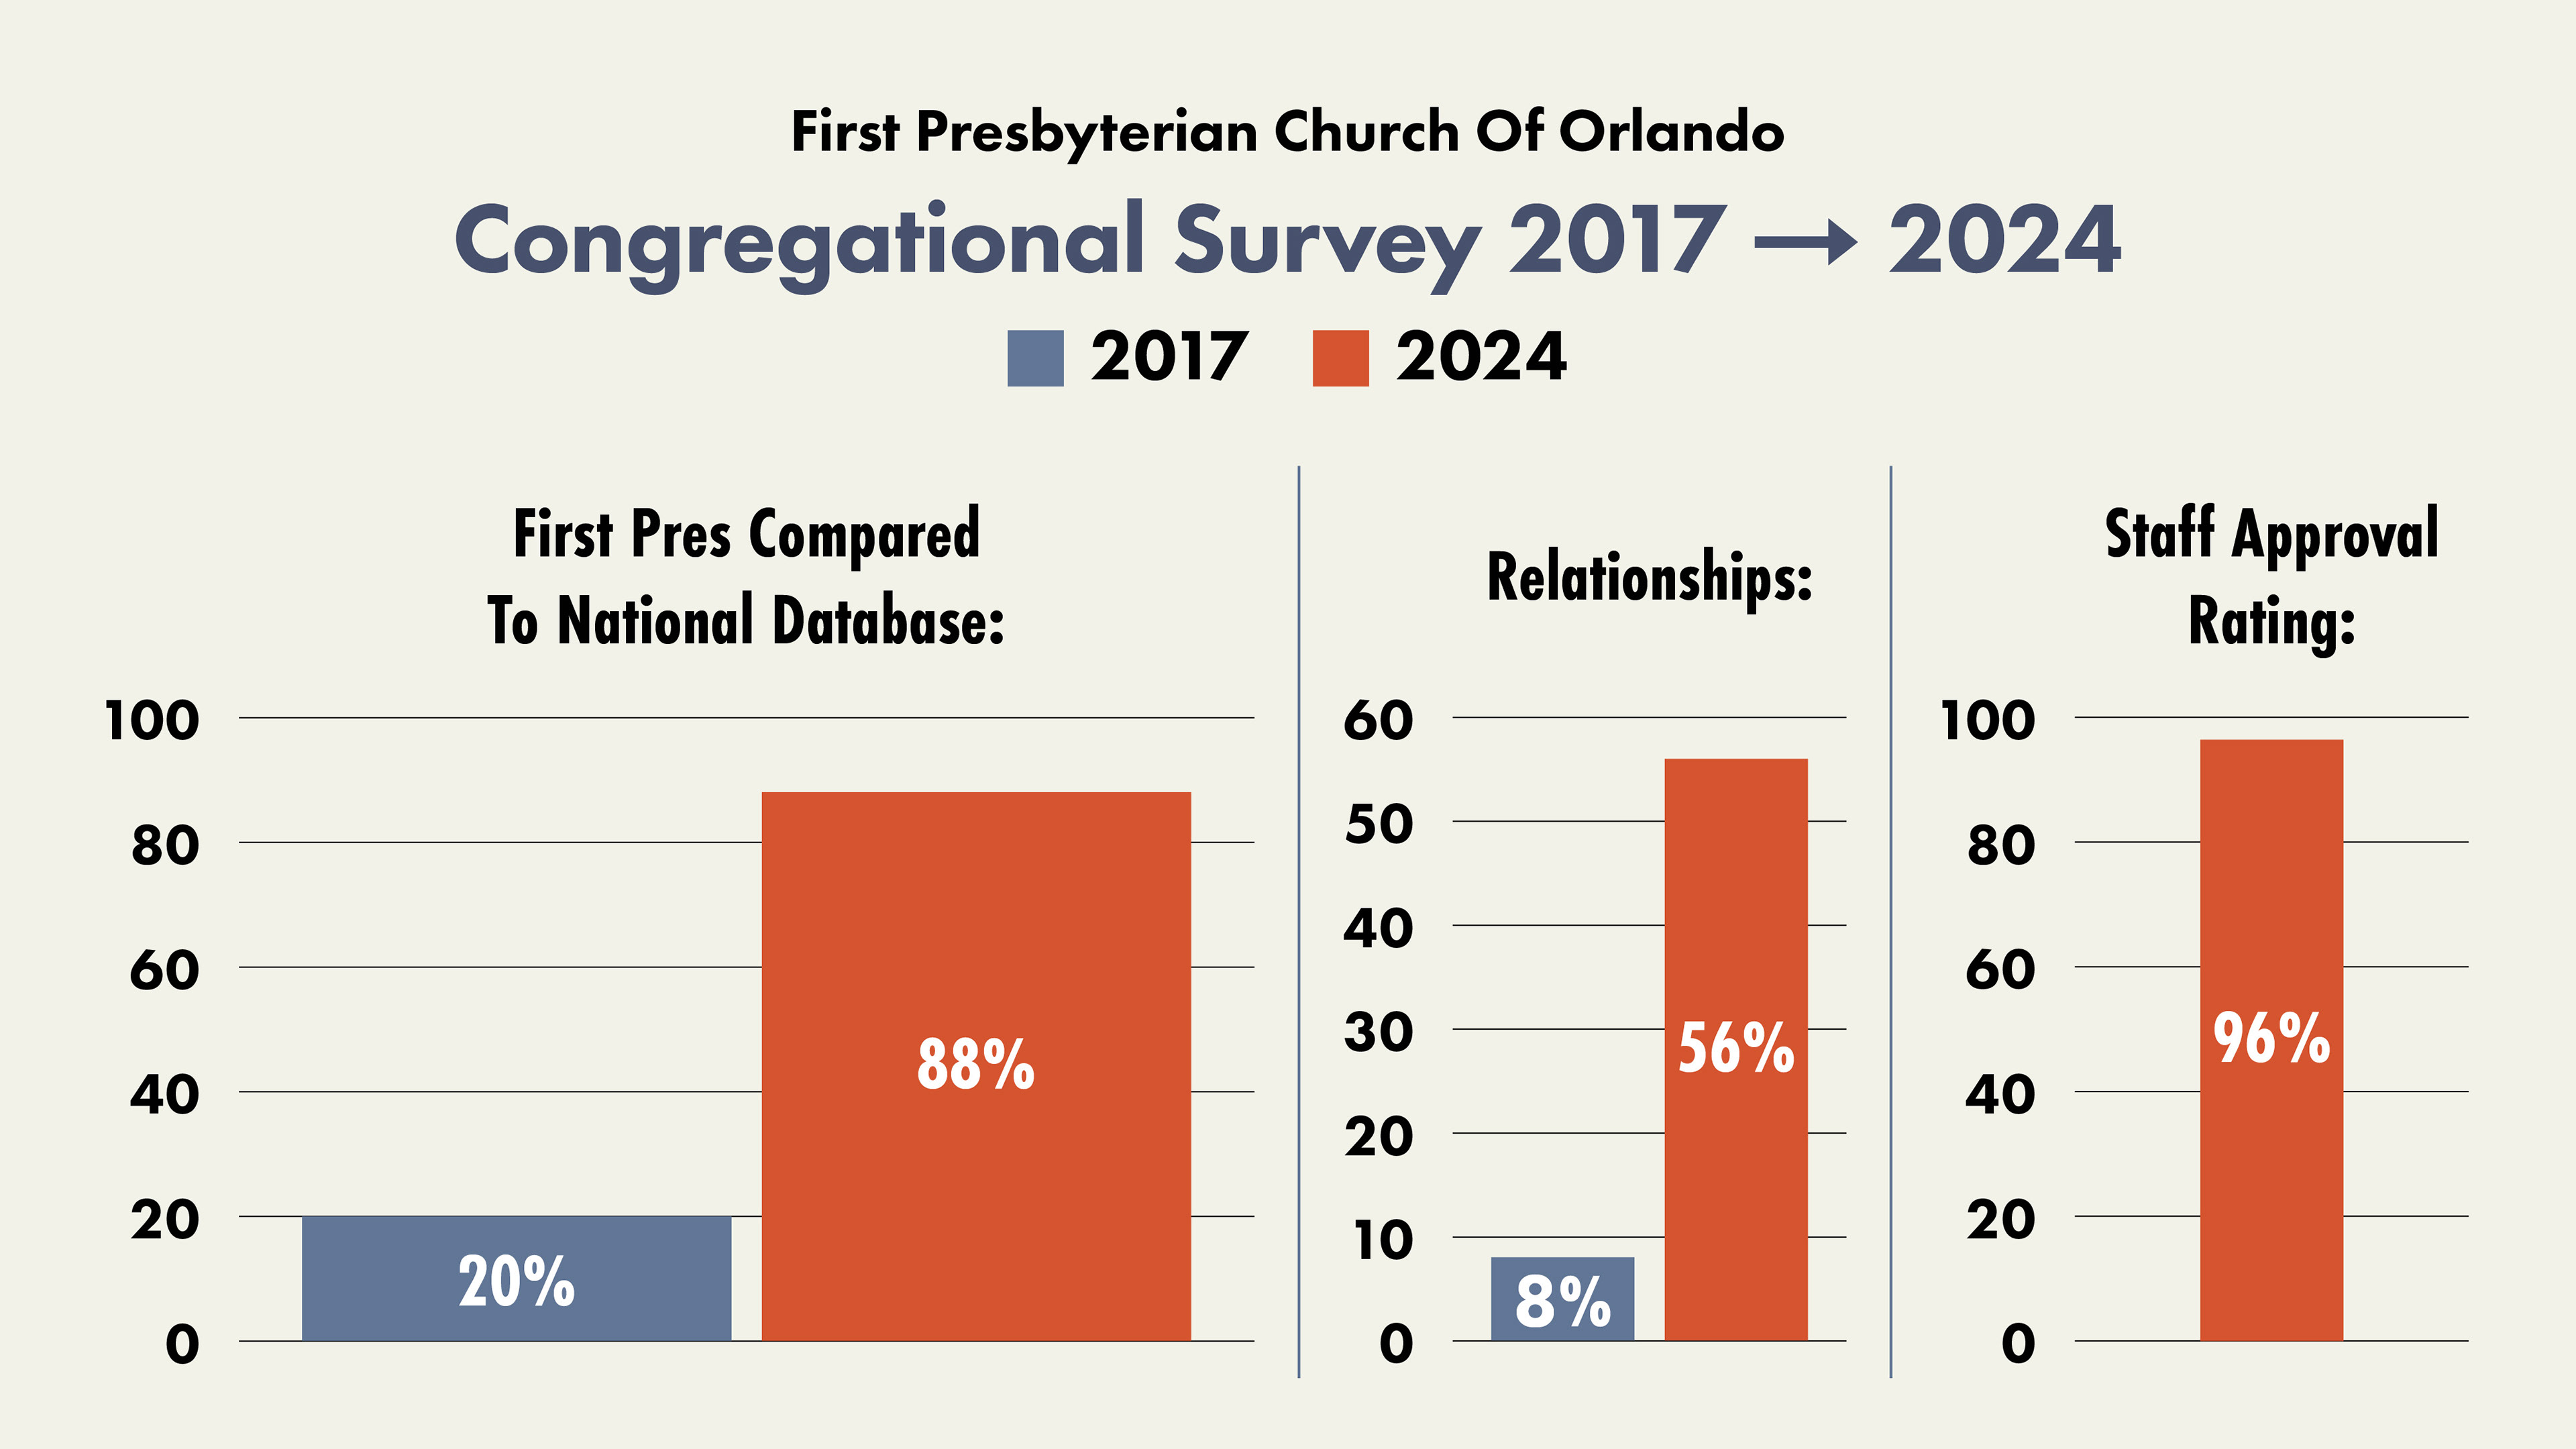
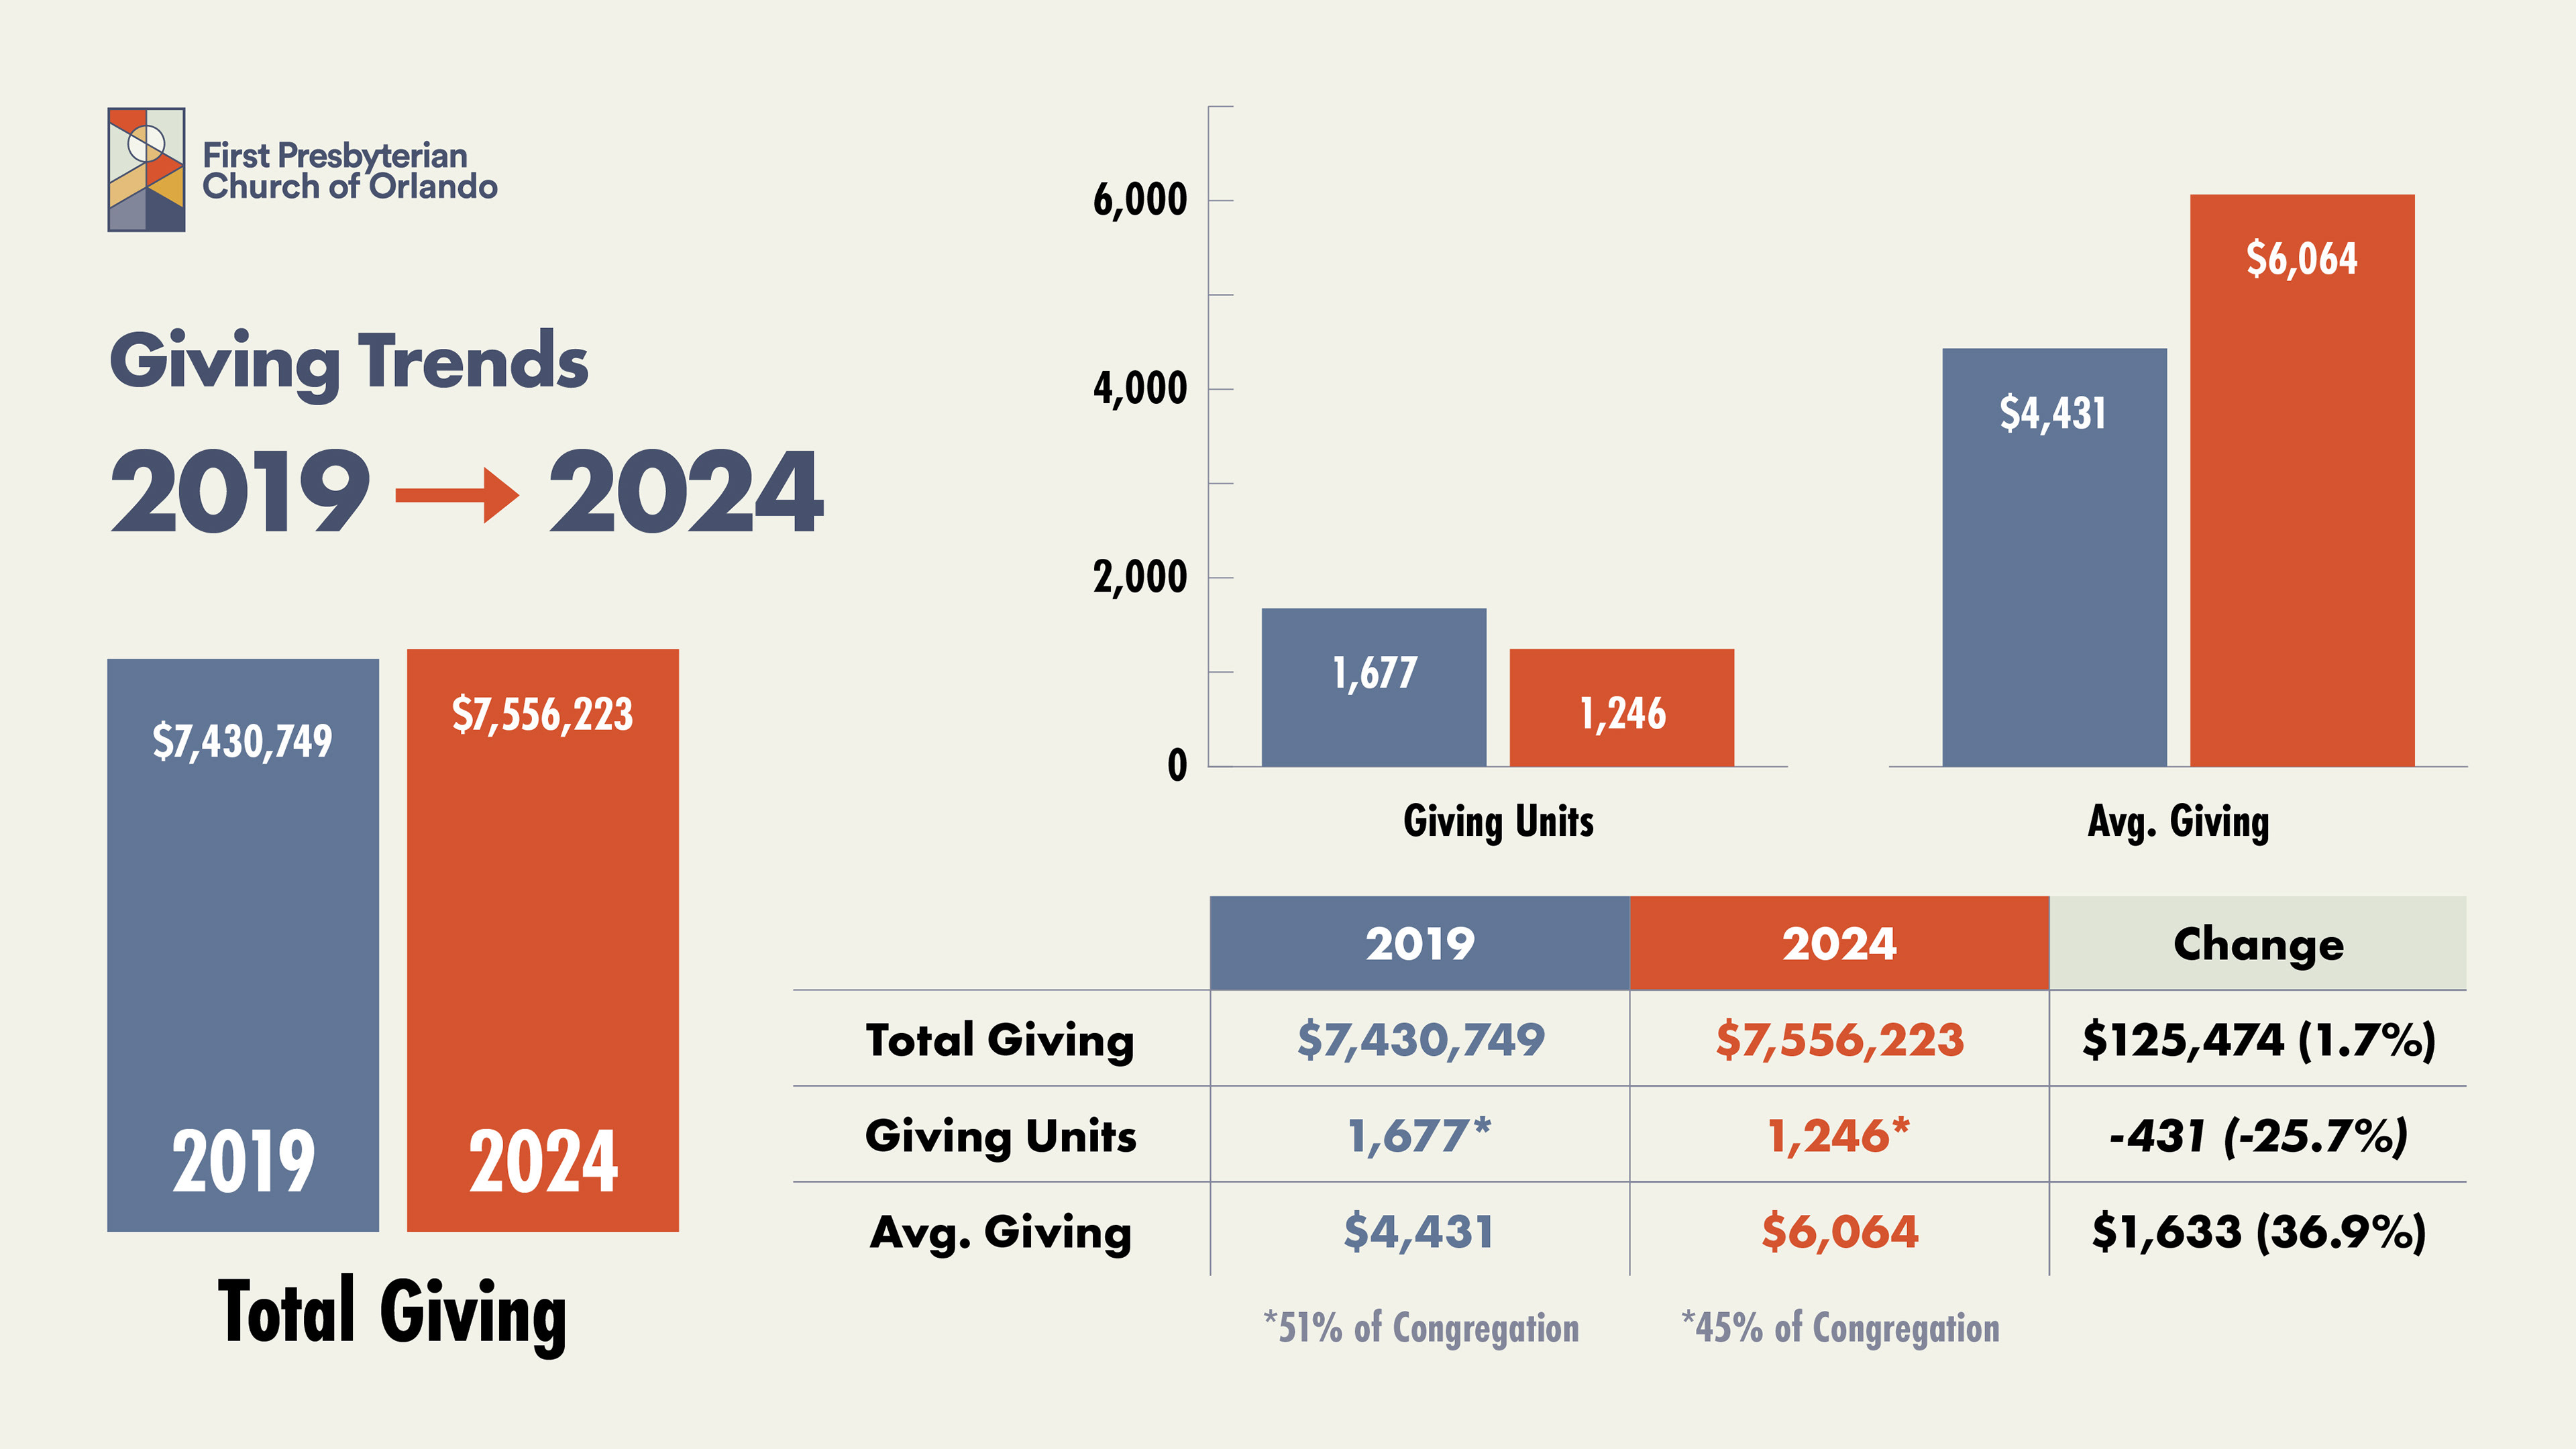
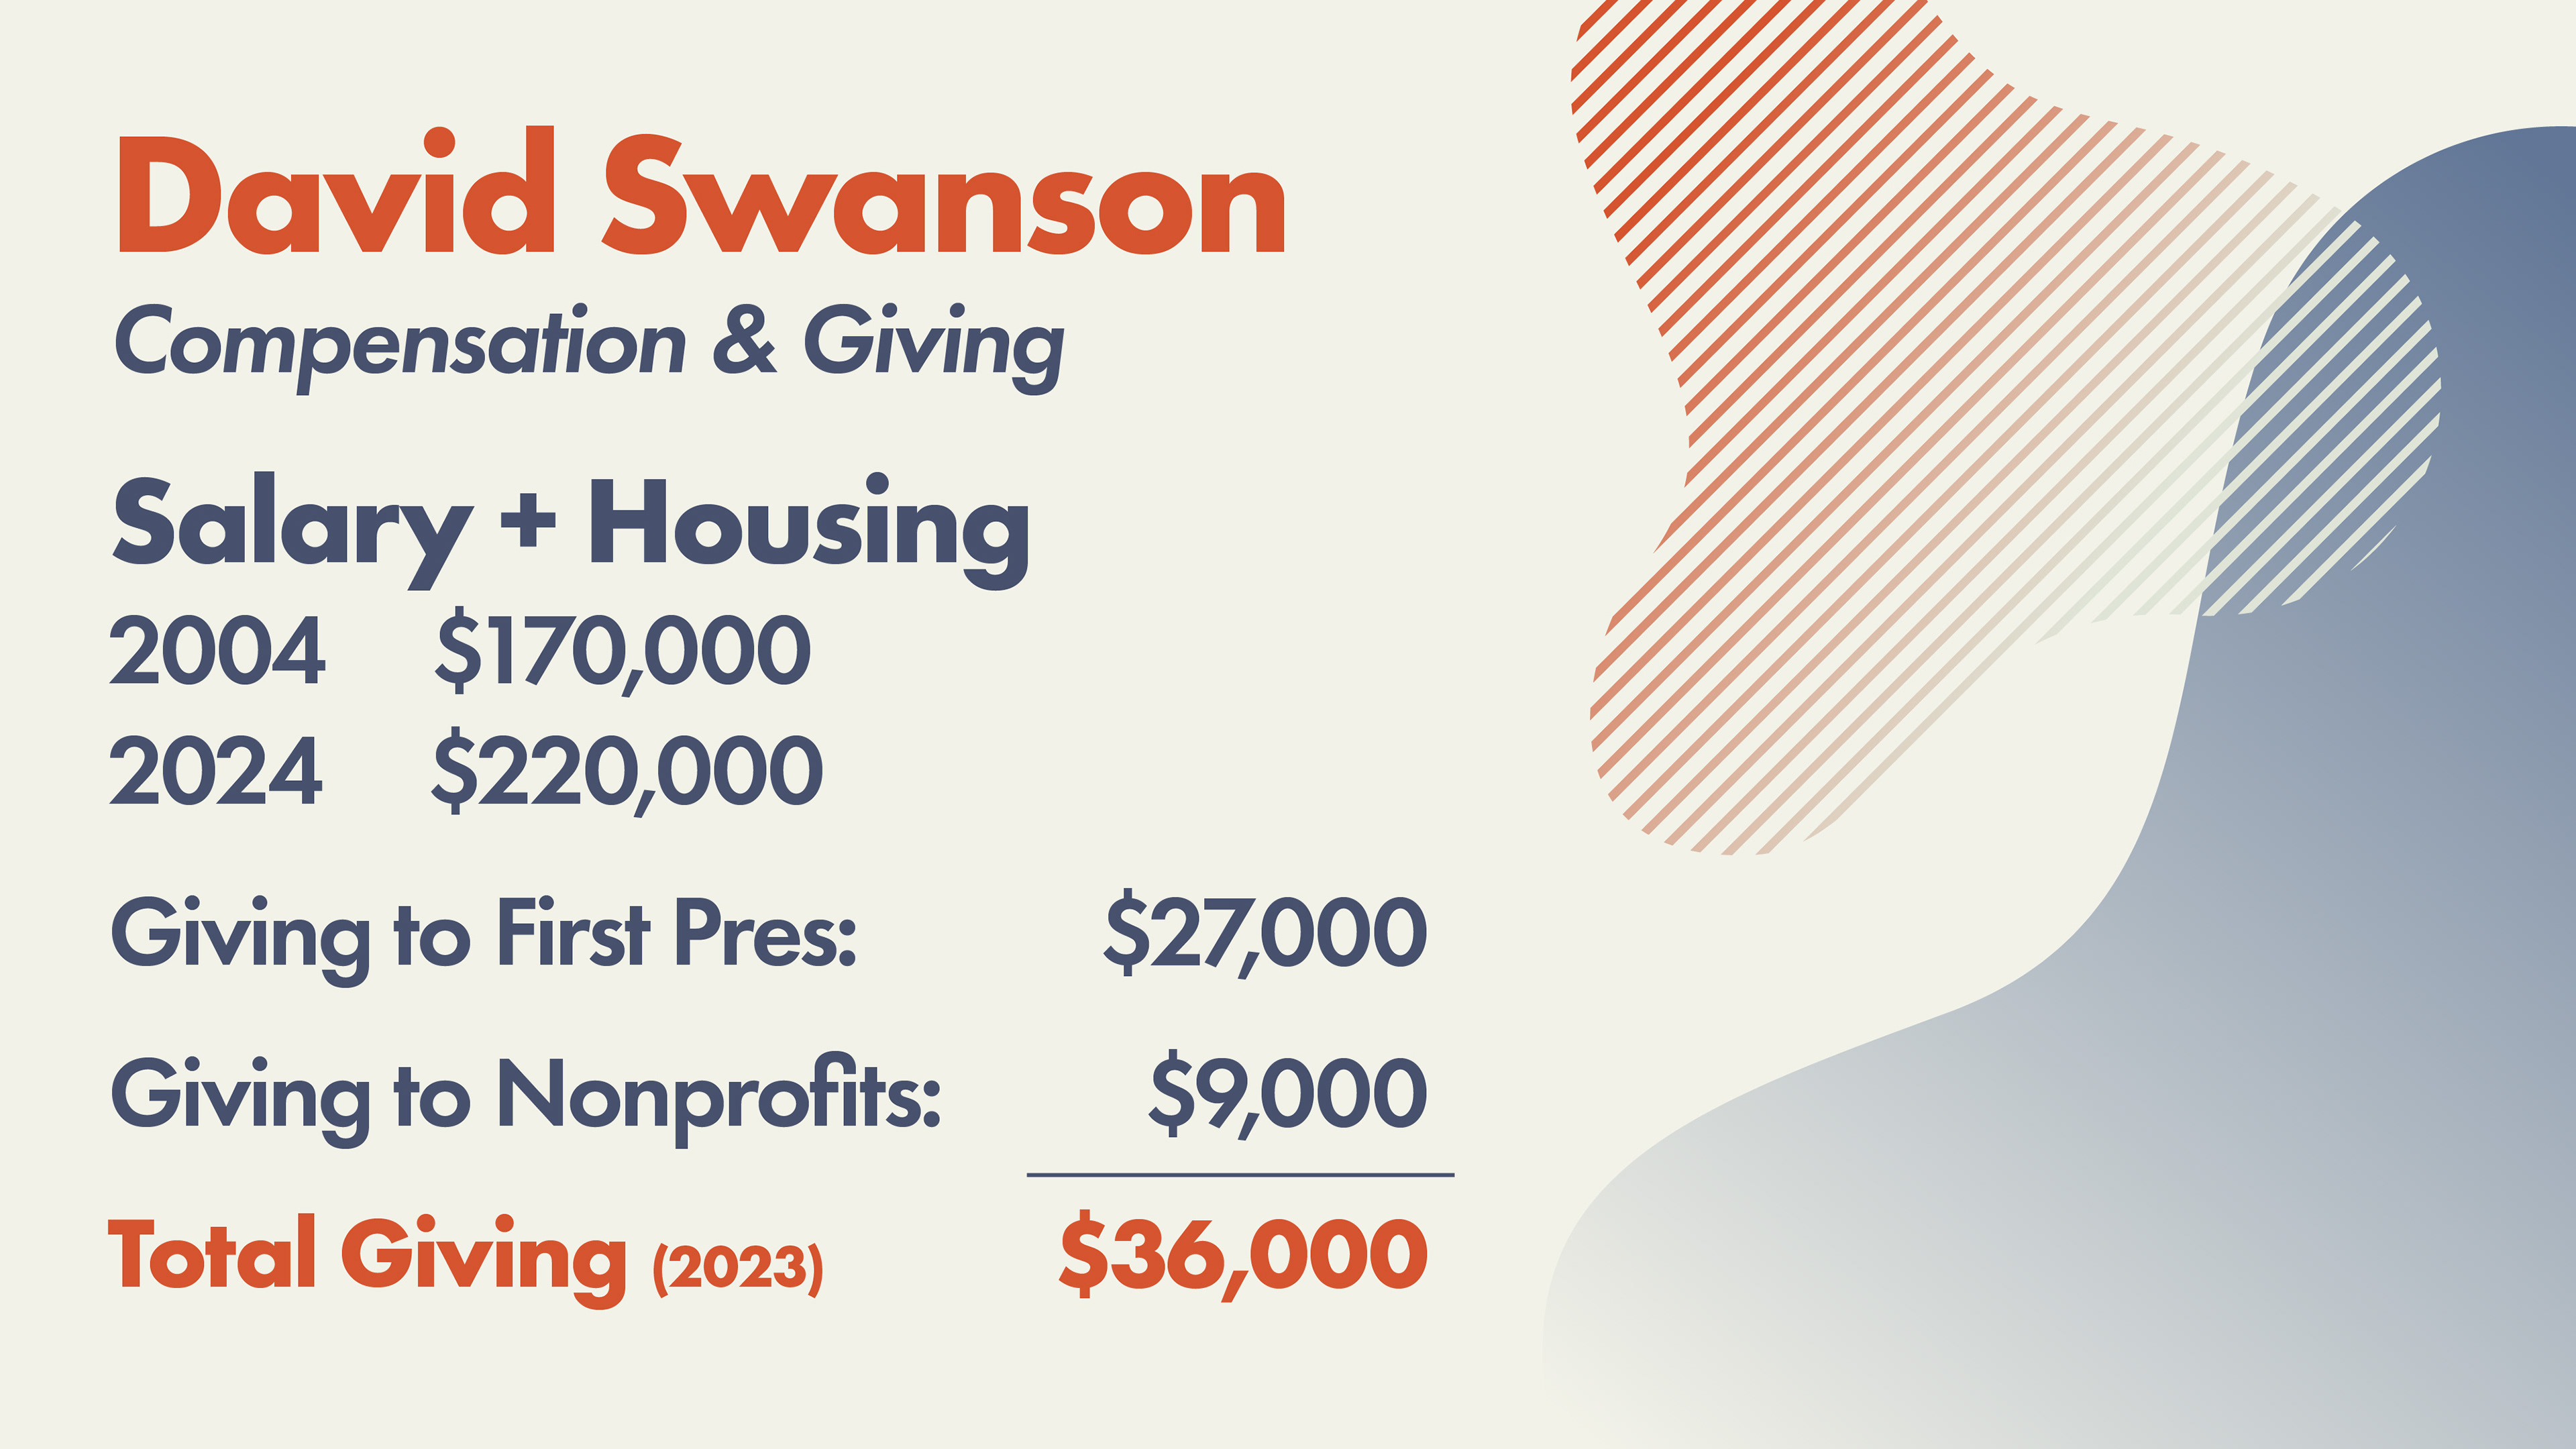
Here are examples of data-driven slides I designed for First Presbyterian Church of Orlando, created to effectively present key insights to stakeholders.